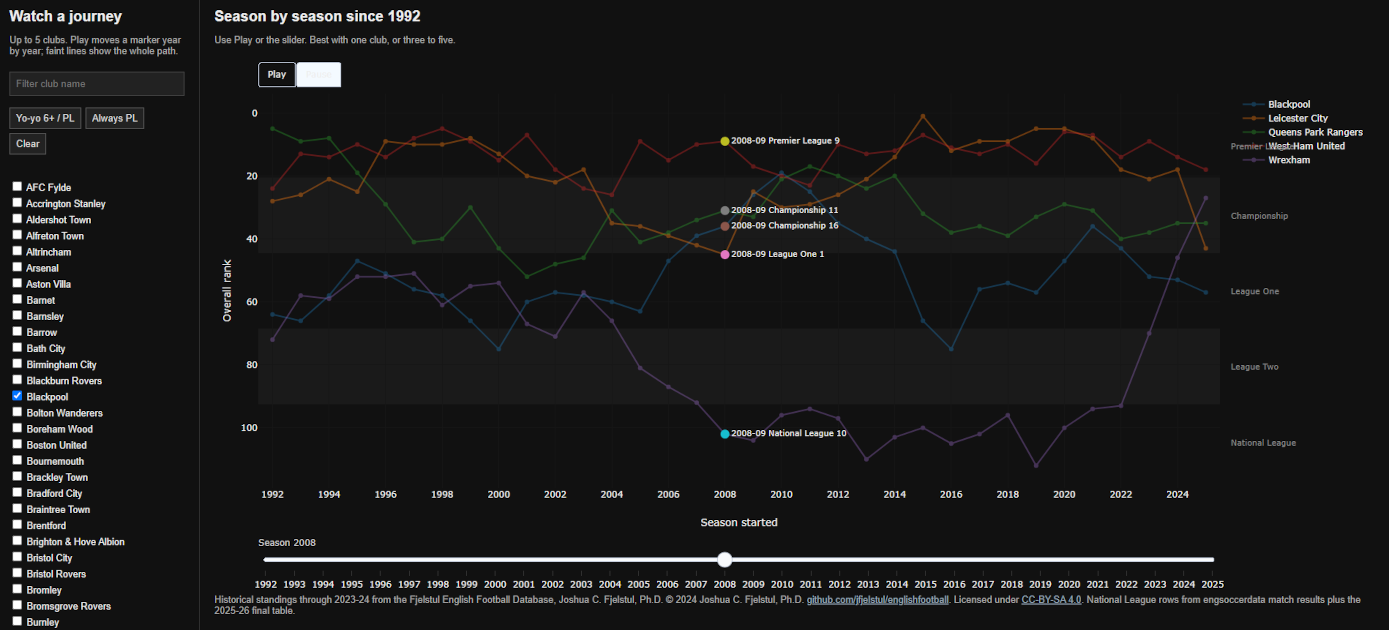
Open the pages
Going up—and down: the first floor
I’ve long been fascinated by the movement within English football—not only who finishes at the top, but which clubs rise, fall, disappear, and eventually find their way back.
The champions are easy enough to remember. The journeys are messier.
Since the Premier League began in 1992, clubs have been moving through five nationwide divisions: the Premier League, Championship, League One, League Two, and National League. Some barely move at all. Others seem to spend decades riding the football elevator.
This is the sort of idea I might once have mapped by hand—or simply filed away as interesting but impractical. New data and visualization tools make it possible to dust off ideas like this, follow the curiosity, and see what shape they take.
So I built a small public notebook of English football’s movement since 1992.
Each club-season is one row. Promotion and relegation are recorded as an actual change of tier the following season—not merely a place in the play-offs.
Follow a club
Open the [interactive bump chart] and select a few clubs.
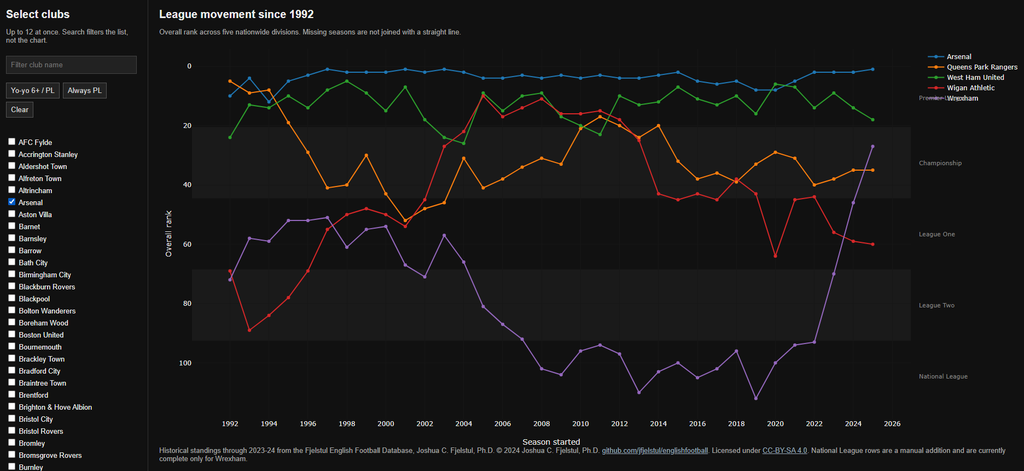
Seasons run from left to right, while finishing positions run from top to bottom. The colored bands represent the five divisions. When a club crosses from one band to another, it has been promoted or relegated. A break in its line means it was outside the five-tier pyramid that season.
Wrexham, Luton, and Stockport offer some dramatic descents and climbs back. Leicester and West Ham provide rather more frequent use of the elevator between the top two floors.
Or choose your own club and see where the line leads.
Browse the ledger
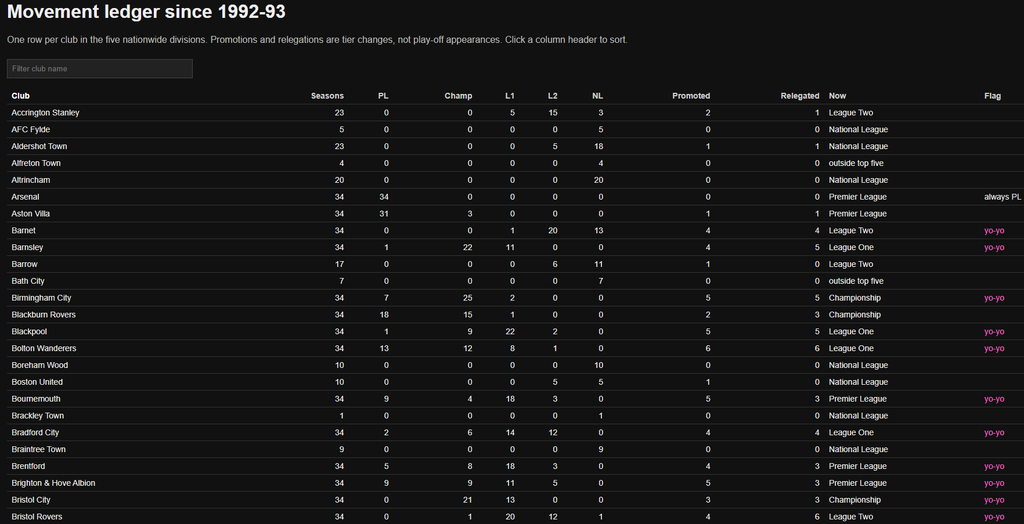
The [club ledger] condenses each club’s history into a single row: seasons spent in each division, promotions, relegations, and current position.
Filter by club name or sort any column. It is a simple way to find the steadfast, the upwardly mobile, and the committed yo-yos.
See the static version
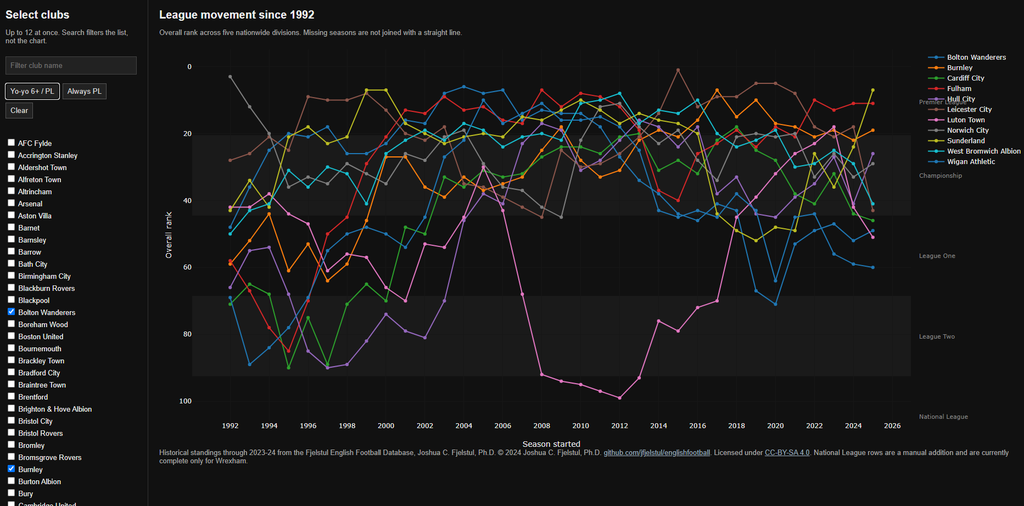
The [static bump chart] follows a fixed selection of clubs for a less interactive—and somewhat less labyrinthine—view of the same movement.
Watch a season
Same data, one club at a time: Play the slider [animated bump chart]. A marker walks year by year so you can pause on the drop or the climb. Best with one name, or three to five.
The data
Historical tables through 2023–24 come from Joshua C. Fjelstul, Ph.D., The Fjelstul English Football Database, © 2024: github.com/jfjelstul/englishfootball, licensed under CC BY-SA 4.0.
I added the 2024–25 and 2025–26 tables for the top four leagues. National League tables not included in the Fjelstul database were built from engsoccerdata match results, supplemented by the published 2025–26 final table.
Club names have been normalized so that, as far as possible, the same club remains the same line throughout.
The charts currently stop at the end of 2025–26. The elevator, of course, does not.
A small technical note
Fjelstul’s data begins as season-by-season standings. A Python pipeline joins those standings into a single club-season dataset, compares each club’s tier with the following season, and marks it as promoted, relegated, or unchanged.
The visualizations are then generated as self-contained HTML pages using Plotly in the browser. There is no application server humming away behind them—just data, a little code, and an old curiosity made newly explorable.